Orange County
EpiCenter Summary
There are ongoing investigations to match the most accurate and related information to proven solutions.
.
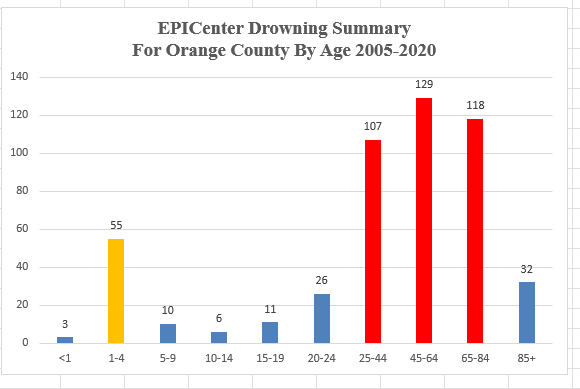
Orange County Summary 2005-2020
Injury summary drowning data by age, sex, and race from 2005 through 2020.
The following information is from a query of the State of California Department of Public Health Online Injury Data System called EPICenter.
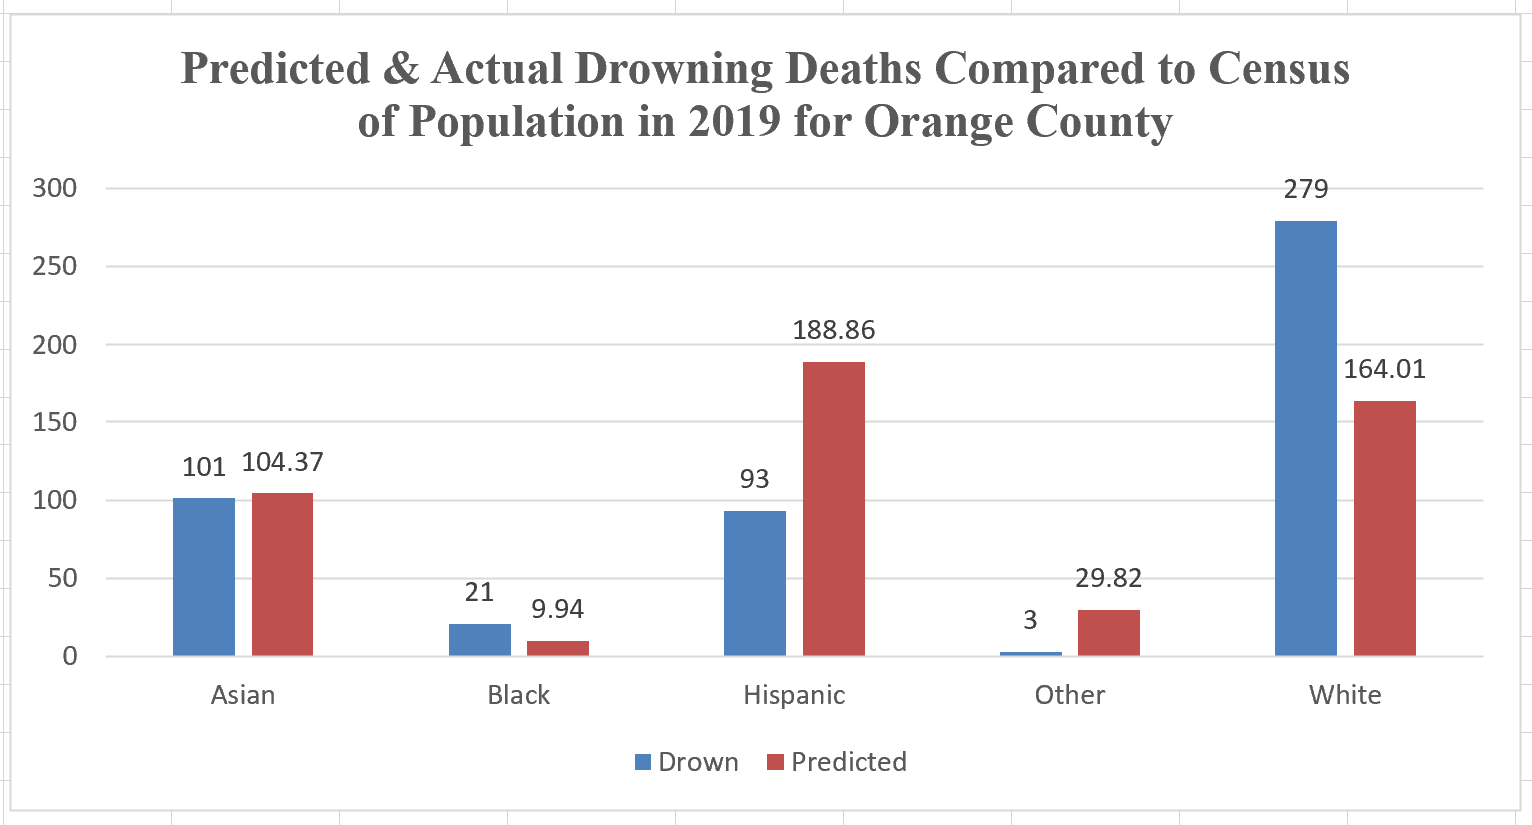
Predicted & Actual Drowning Deaths and ED Visits for Drowning refers to actual reported statistics from the California EpiCenter Online Data reporting tool, and EpiCenter defined grouping: Asian, Black, Hispanic, Other, and White categories by percent of population. EpiCenter data is multiplied by Predicted racial percent and the reported number of drowning deaths or emergency department visits.
2005-2020 deaths with 2019 US Census data by race for Orange County: Asian 21%, Black 2%, Hispanic 38%, Other 6%, White 33%.
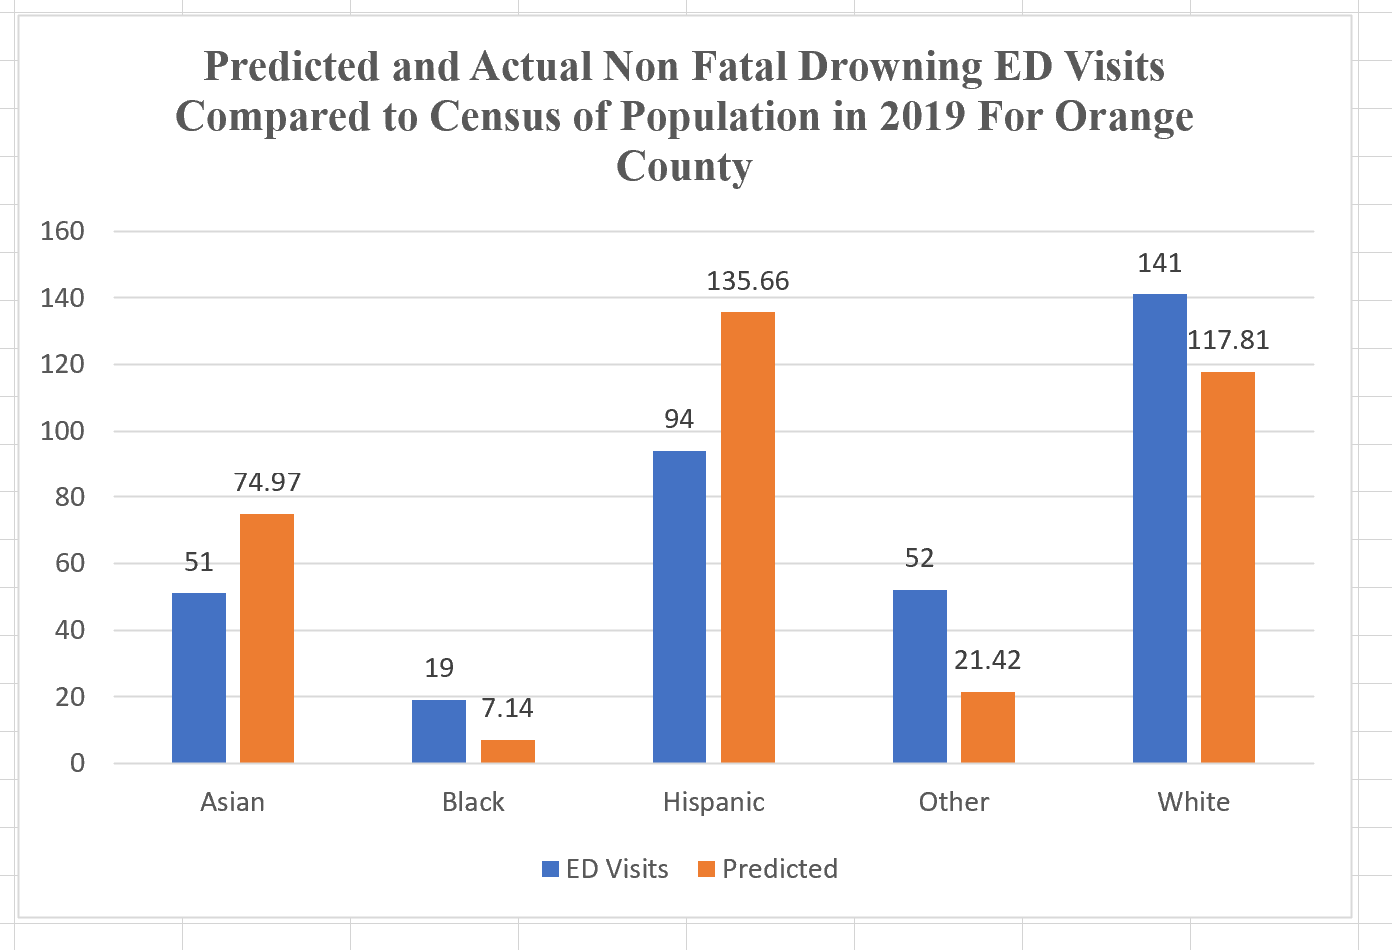
Emergency Department summary drowning data from 2006 through 2015.
Predicted & Actual Drowning Deaths and ED Visits for Drowning refers to actual reported statistics from the California EpiCenter Online Data reporting tool, and EpiCenter defined grouping: Asian, Black, Hispanic, Other, and White categories by percent of population. EpiCenter data is multiplied by Predicted racial percent and the reported number of drowning deaths or emergency department visits.


